How we assess bird populations in Maine’s commercial forest
sdsd
Our main method of assessing bird populations is called a point count. We go to a predetermined point in the forest and count all birds seen or heard in 10 minutes. We can then extrapolate the abundance of a species across the larger landscape using timber stand maps provided by the landowners.
We’re also doing a more detailed substudy of avian productivity. Point counts tell us what bird species are present in each stand type (forest type), but point counts don’t tell us if the species is actually breeding and raising young. On a subset of points, we’re conducting a productivity survey, described below.
(click on picture above to play short video clip)
The Point Count
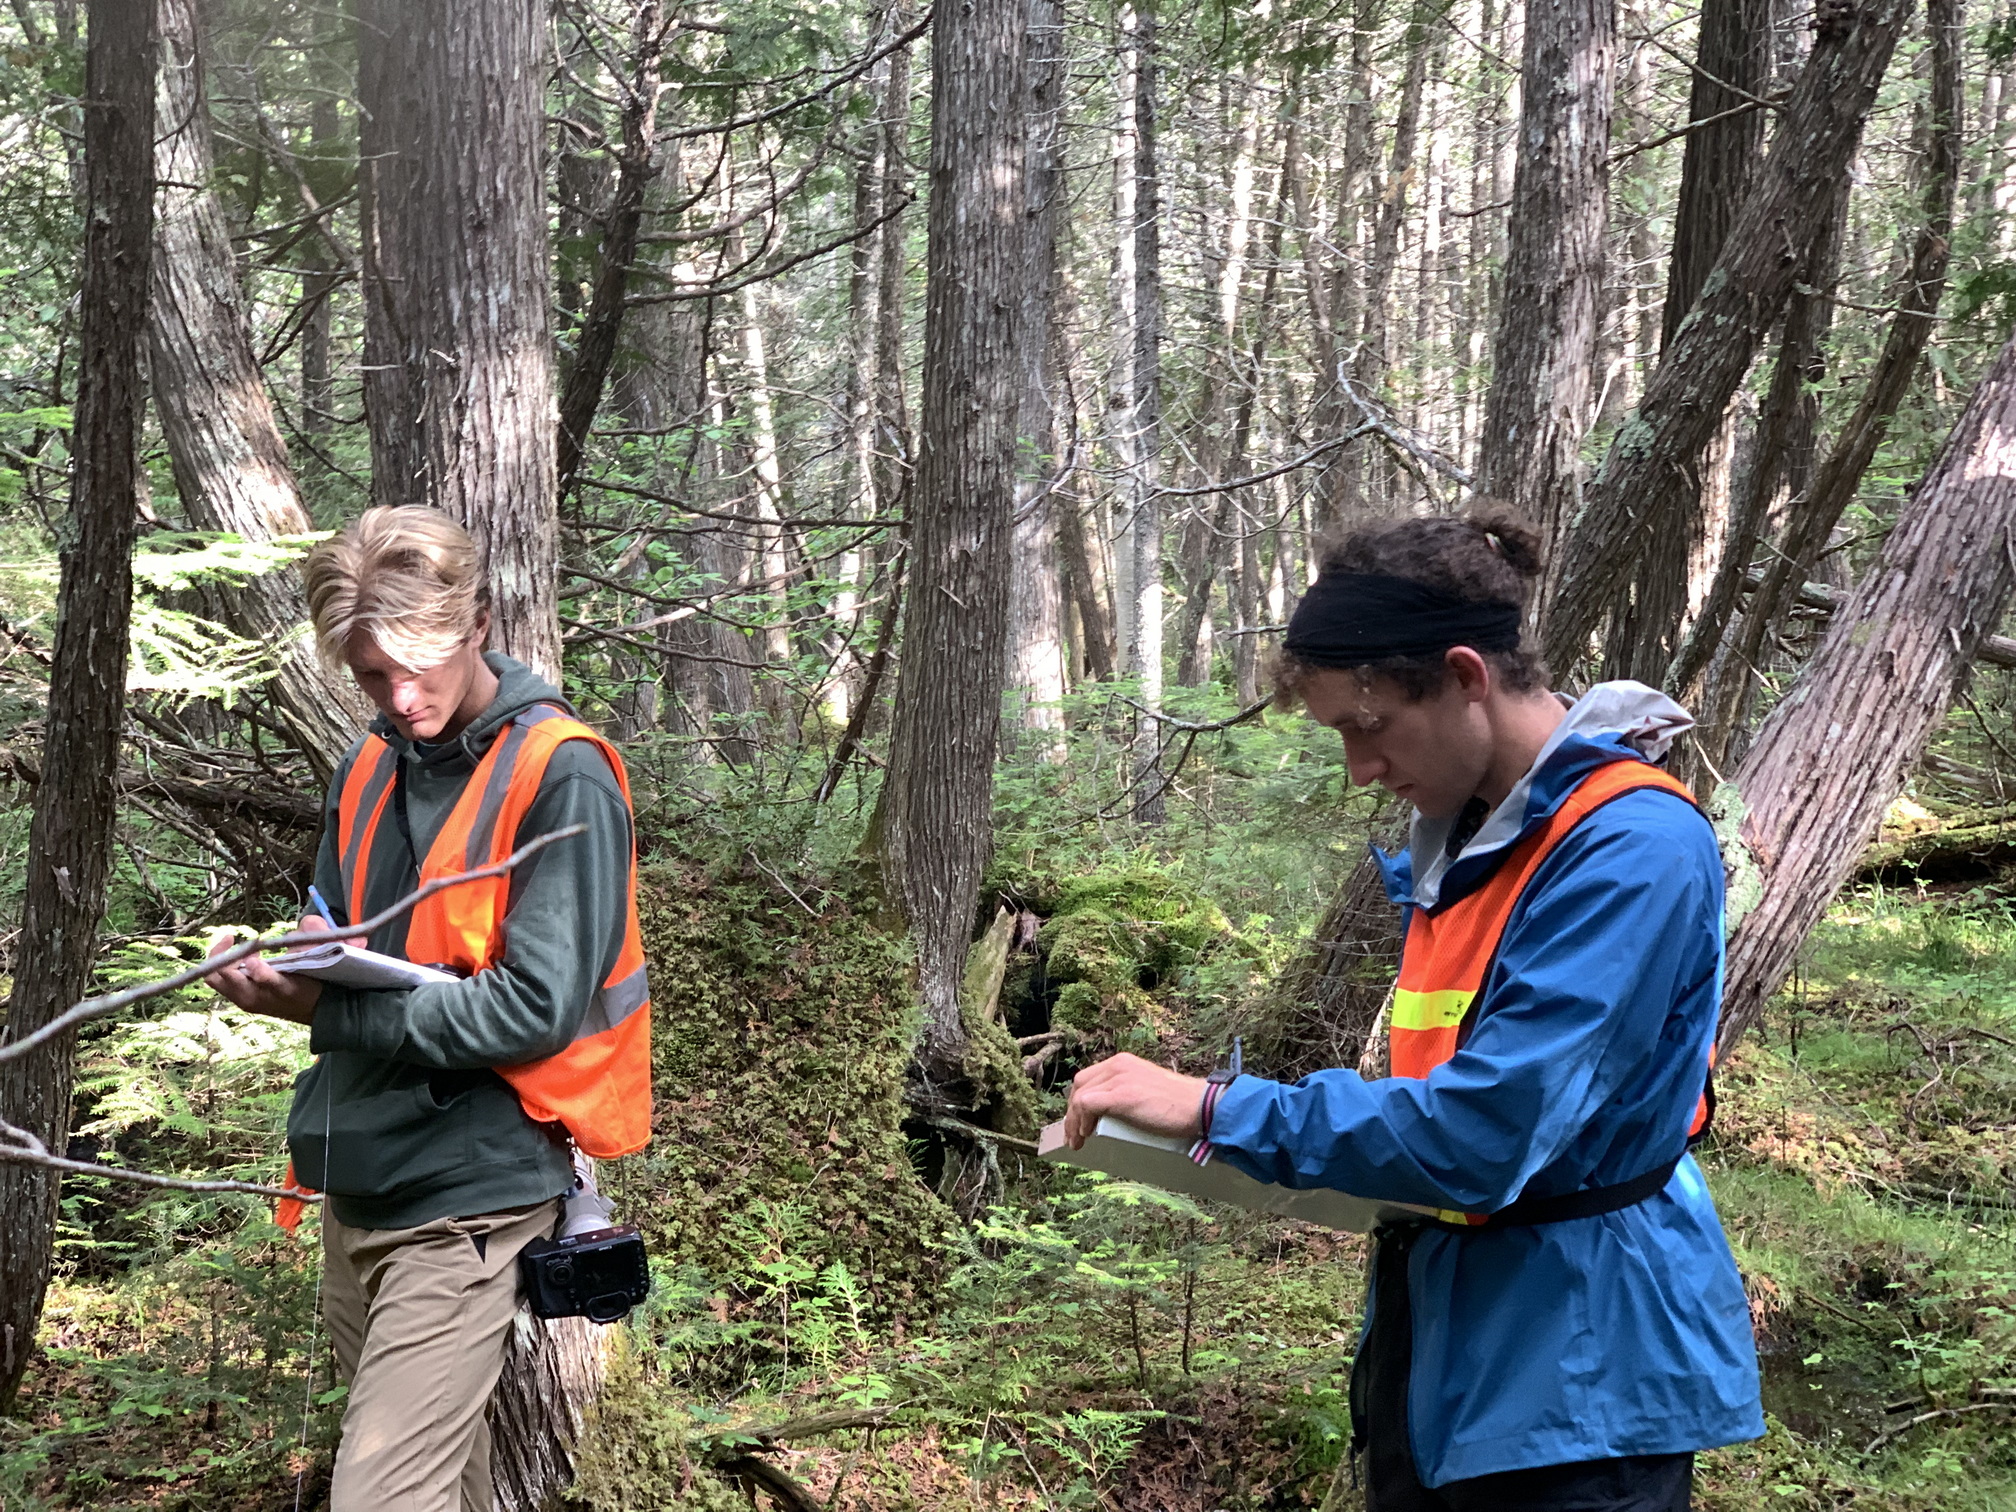
The “point count” is the most commonly used method to systematically survey bird populations. First, we “flag in” a path and establish a point count station in the forest at least 100 m from a logging road. This way, we avoid road effects on birds. We then count every bird we see or hear for 10 minutes. For purposes of analysis and estimating density, we distinguish between birds within 50 meters of the point count station, and birds outside this fixed-radius circle. Point counts are done between sunrise and about 10:30 AM, the window of the day when birds sing the most. Teams usually work in pairs and cross-check with each other at the end of the 10-minute sampling period to make sure nothing was missed. The team has surveyed 302 new points in 2022, adding to 120 points sampled in 2021. (see map here).
(click on picture above to play short video clip)
The Productivity Survey
The point count method above is great for estimating density of birds in a forest type. But the method is not so good for determining whether birds are breeding and raising young. In a “productivity survey” we are looking for breeding evidence. This requires a modification of the point count method described above, because we want to SEE as many birds as we can. We look to see if birds are carrying nesting material or food for young, or if fledglings are present later in the season.
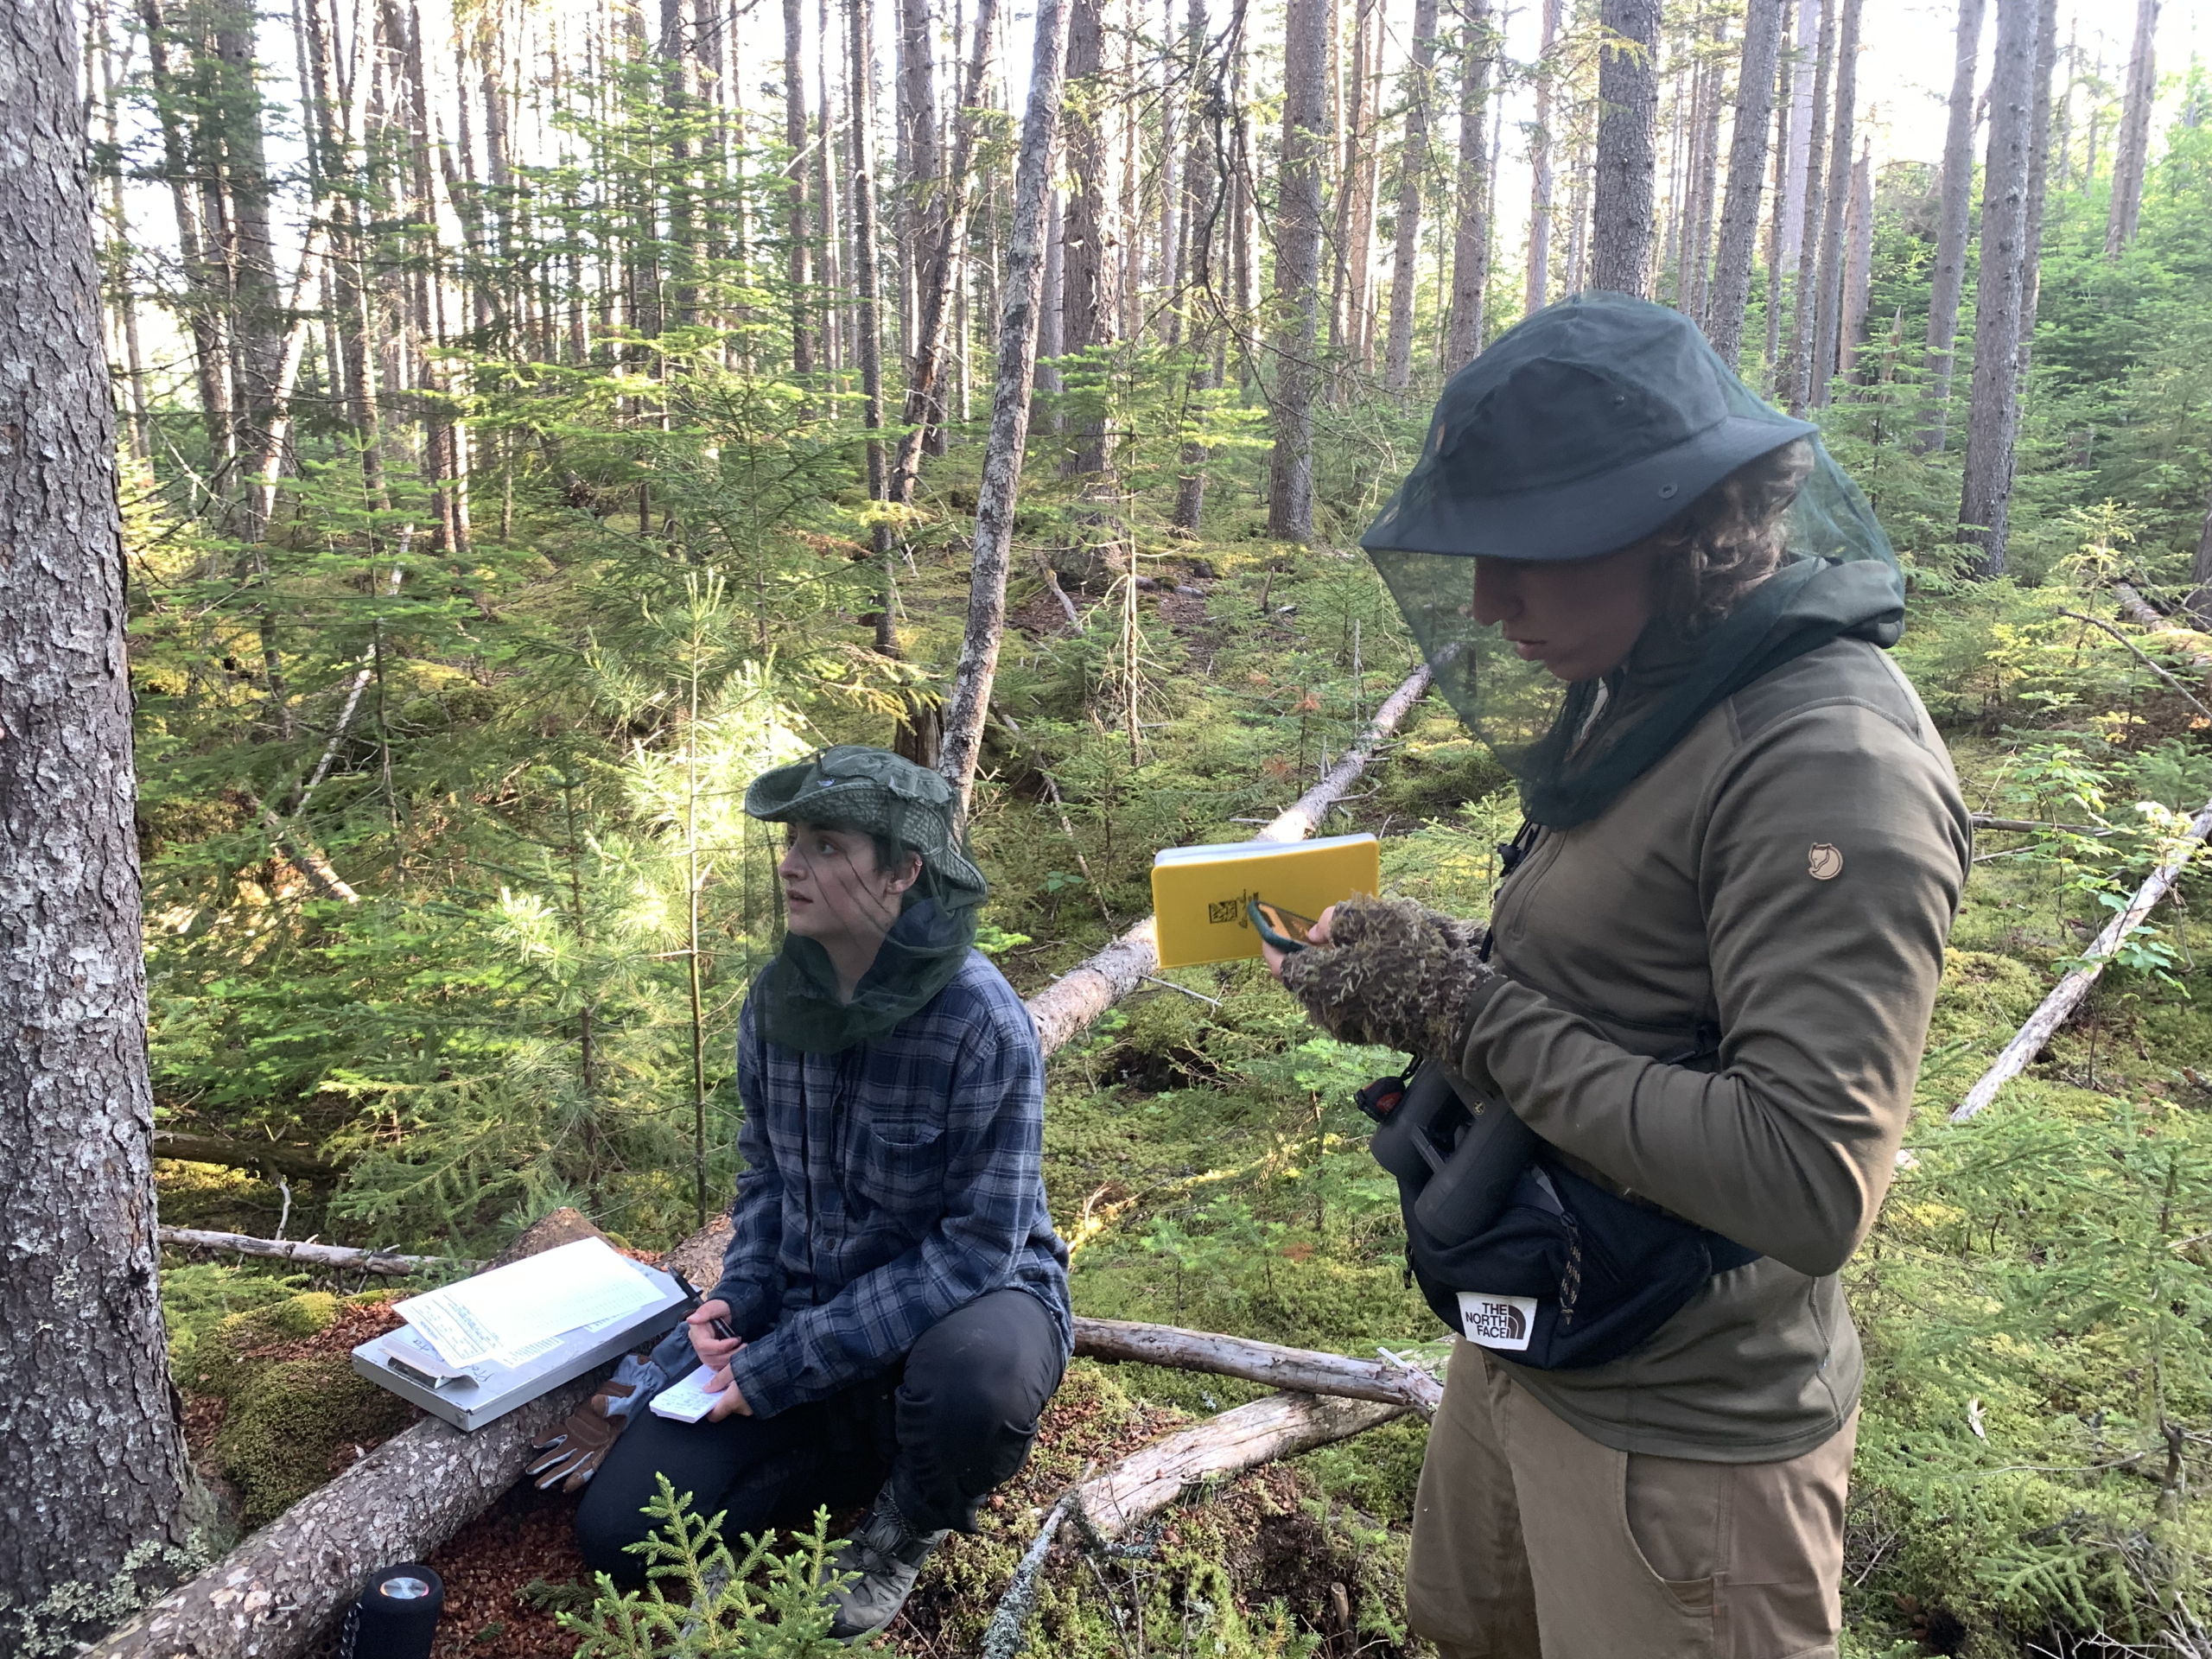
To SEE as many birds as we can, we play a recording of Black-capped Chickadee mobbing call, which tends to bring in all kinds of species curious about the sound. Obviously, this method compromises our ability to calculate bird density because we don’t know from how far away birds are coming from. On the other hand, it DOES allow us to pick up on cues of breeding success, which is the whole idea of the productivity survey. We are careful to keep the point counts separate from the productivity surveys.
Click on the picture to the left to play a short video.
What is a timber stand map?
This study depends on timber stand maps provided by our landowner partners (Weyerhaeuser, LandVest, Appalachian Mountain Club, Huber Forest Resources).
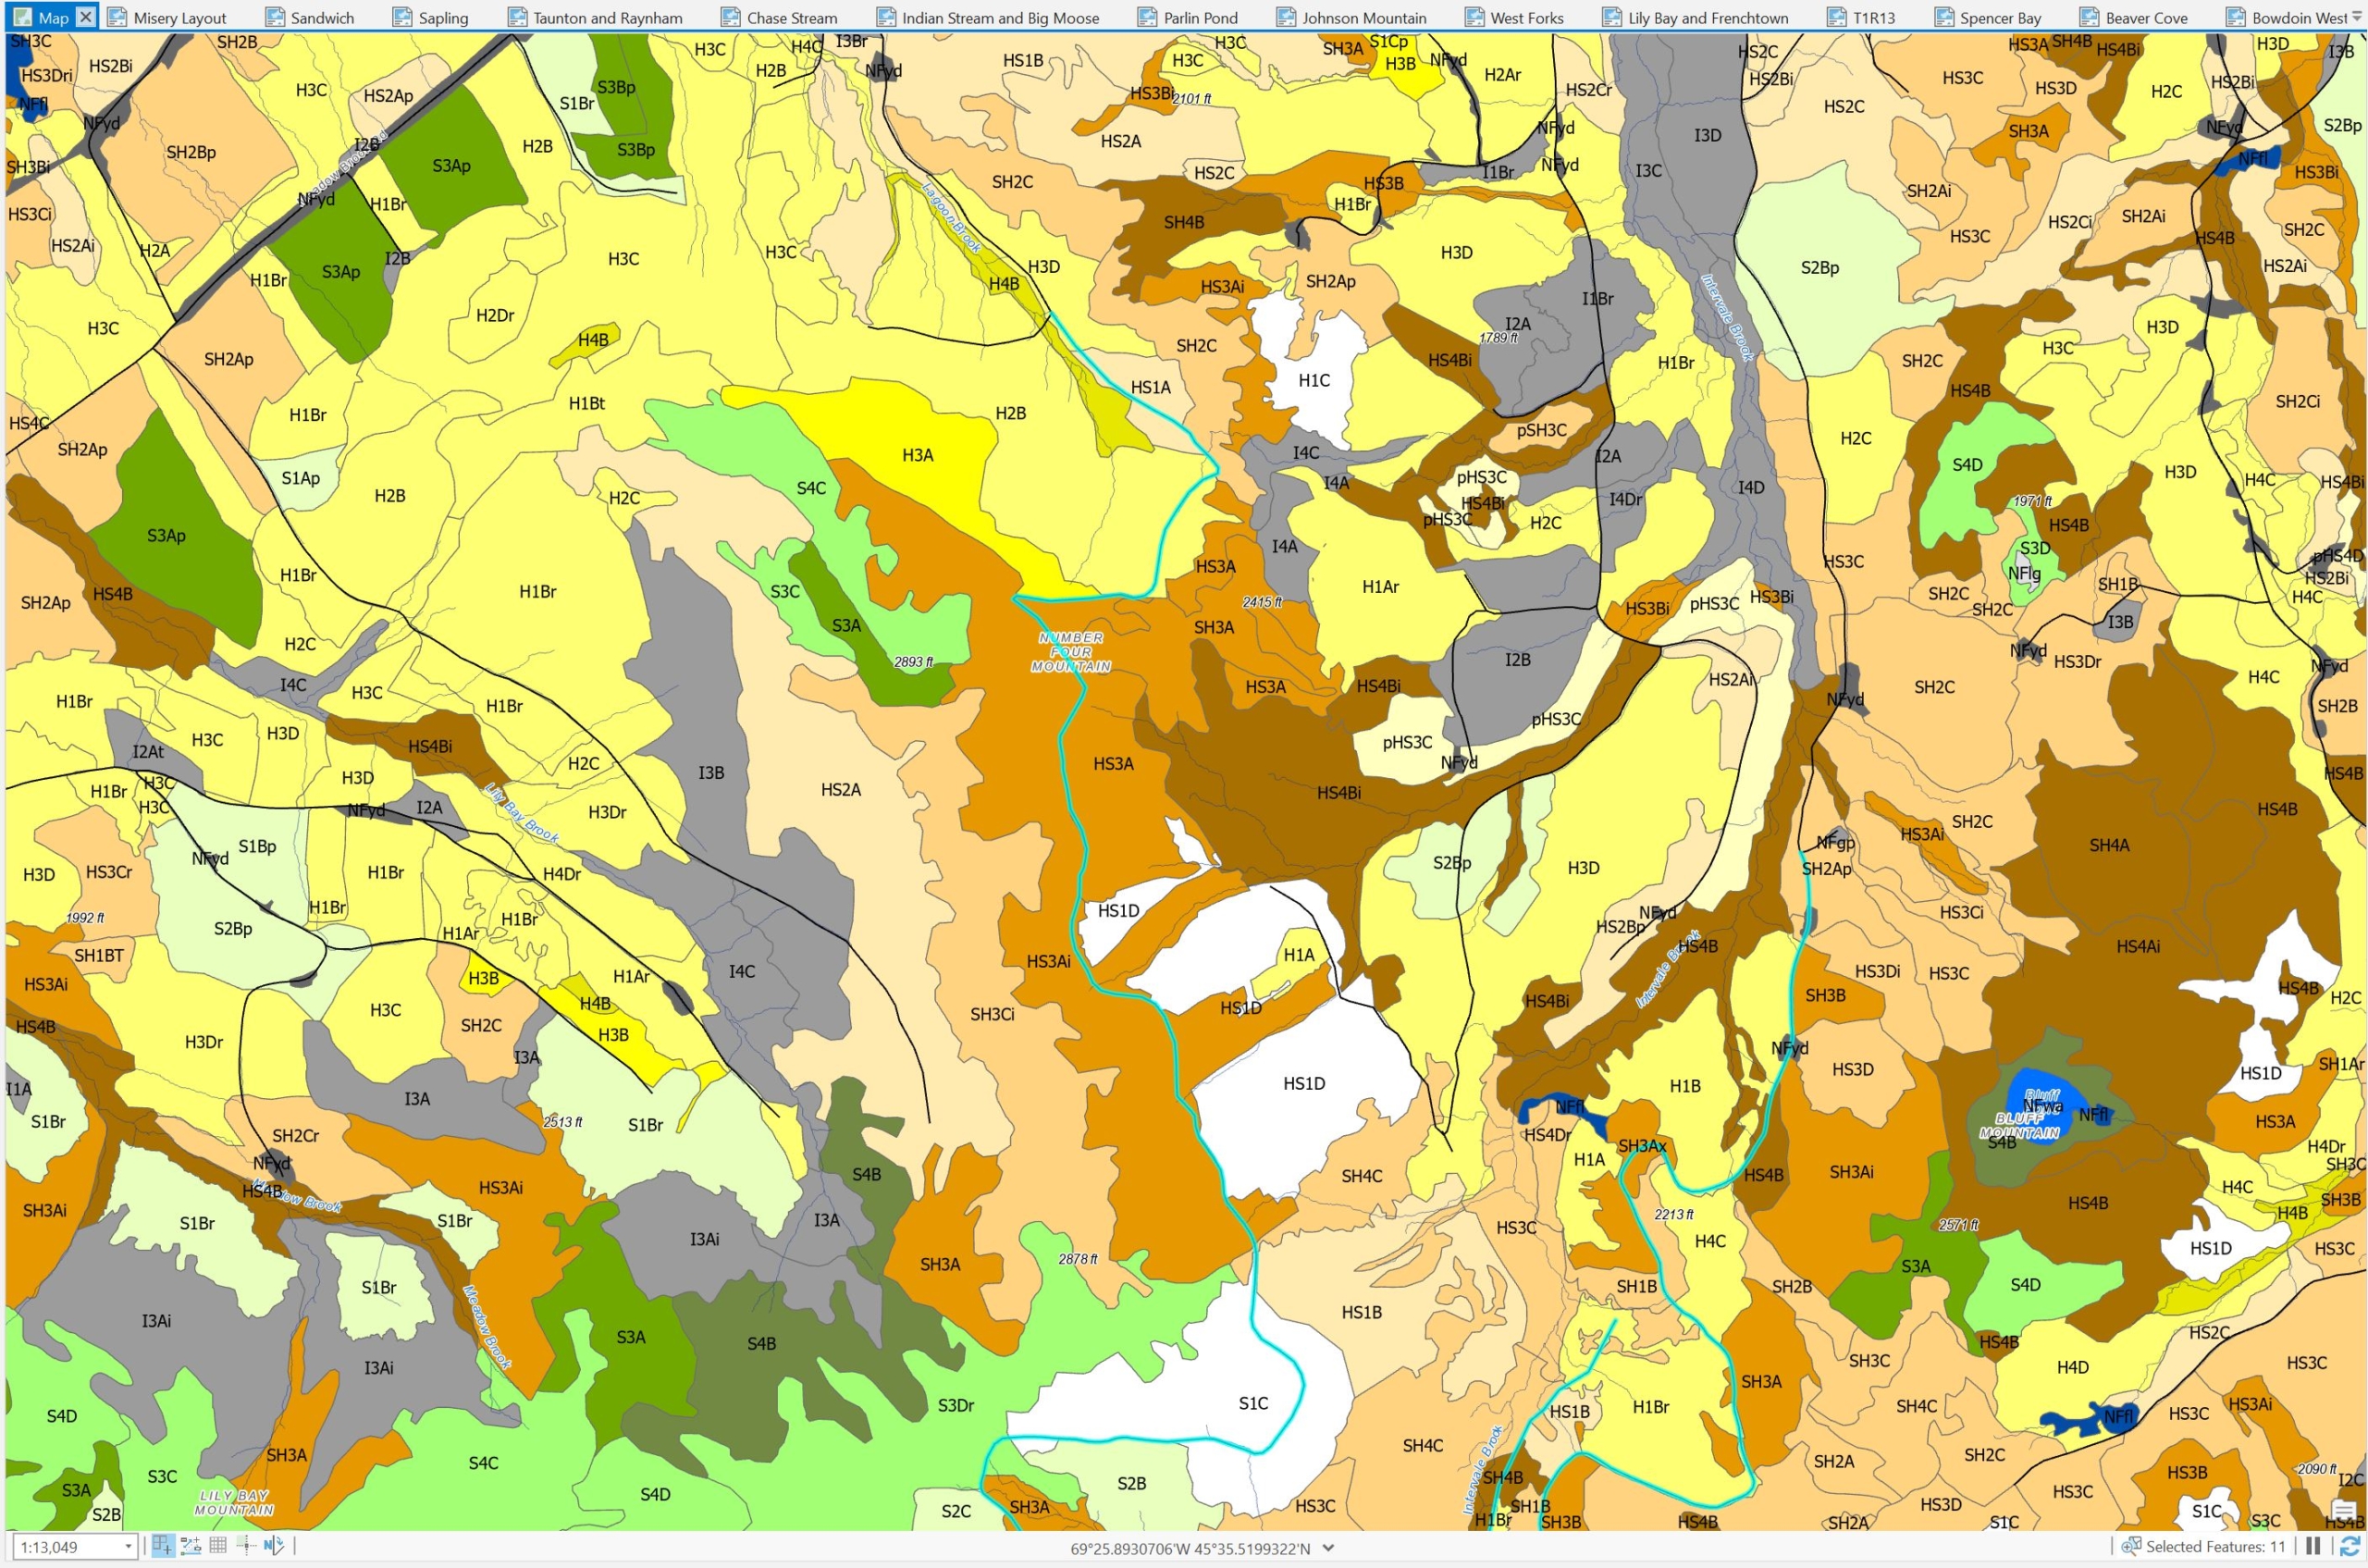
A timber stand map shows all the different age classes and forest types on the landscape, and where they are. Different bird species use different forest types. By systematically sampling all these stand types, we can then extrapolate across a much larger area to estimate the abundance of a species.
Because we have timber stand maps from the original 1992/1993 study, and because we’re using the exact same survey methods, we’re able to compare the abundance of each species in the commercial forest, then and now.
LEFT: typical stand map


